stillorigin / traffic insights
See what's coming in.
The portal shows what reaches your sentries: what was allowed, what was blocked and why, where it came from, which crawlers are real, Captcha Protection activity, and how hard each sentry and origin is working.
The dashboard
Your whole account at a glance.
The dashboard shows traffic totals across every domain on your account, an allowed versus blocked chart, and alerts. It also shows Captcha Protection stats: how many checks were shown, passed and failed.

Screenshots use example data.
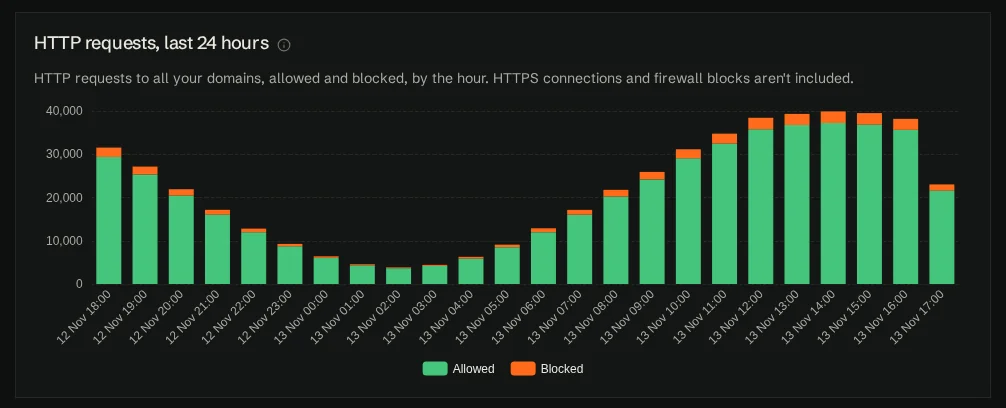
An allowed versus blocked chart shows your busy hours, your quiet hours, and when blocks pick up.
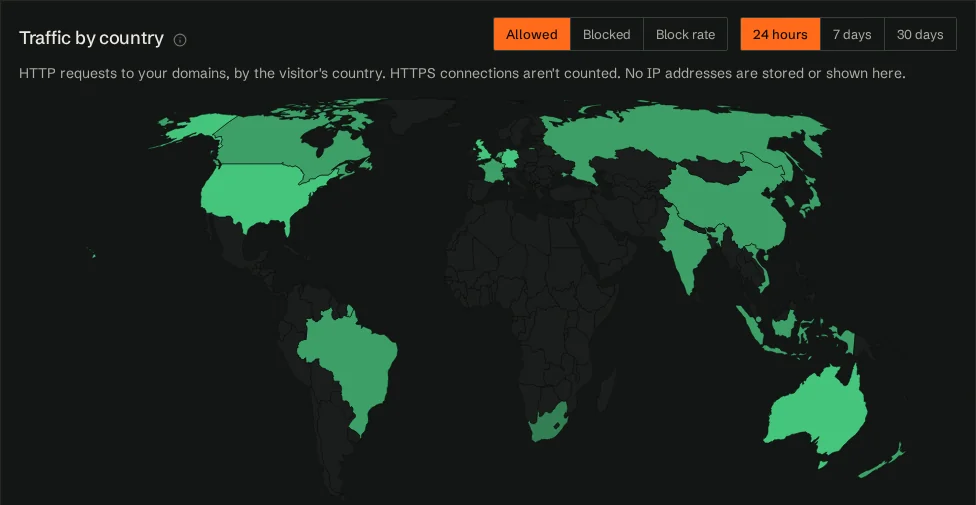
Traffic by country
Where your traffic comes from.
Traffic by country puts all your traffic on a world map, including HTTPS. Passed-through HTTPS connections are counted by country, and HTTPS sites with Website protection on appear as requests. Switch between allowed, blocked and block rate, over 24 hours, 7 days or 30 days, and filter by cluster, sentry or domain.
Country data is kept for 30 days. No IP addresses are stored or shown in this view.
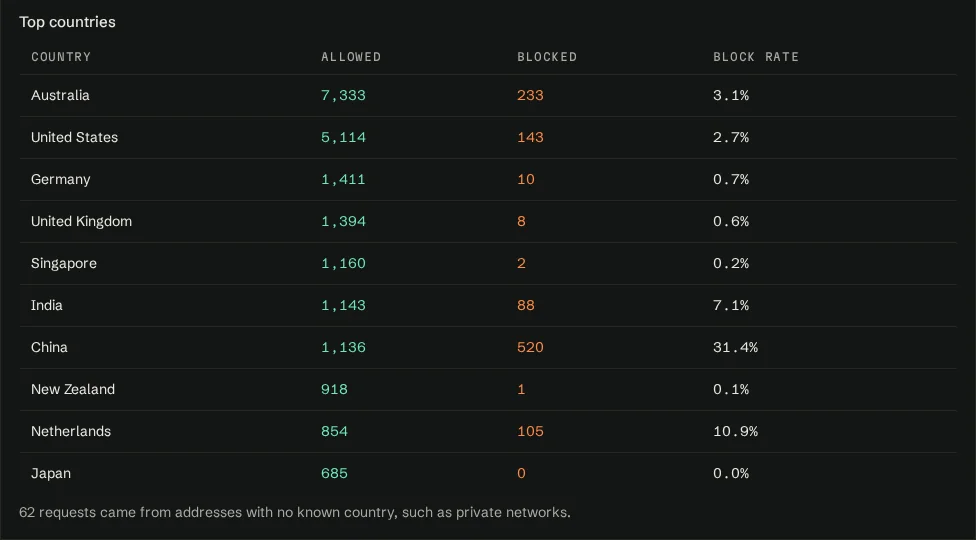
Top countries lists your busiest countries, with allowed traffic, blocked traffic and block rate.
You can also see which network the traffic comes from.
Why traffic was blocked
Blocks, by reason.
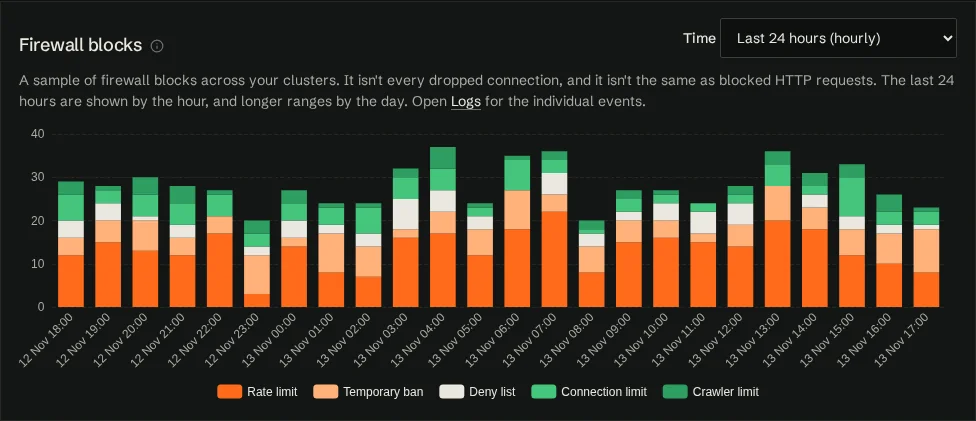
The Firewall blocks chart breaks blocks down by reason: rate limit, temporary ban, deny list, connection limit, crawler limit and origin limit.
View the last 24 hours by the hour, or the last 3, 7 or 30 days by the day.
Identified traffic
Know which traffic you can name.
Identified traffic shows what was allowed and blocked, grouped by type: search and AI crawlers such as Googlebot, Bingbot, GPTBot, Applebot, PerplexityBot, Claude and Amazonbot, plus monitoring and uptime, site management, security platforms and internet scanners. The list grows as providers publish official IP lists.
stillorigin recognises a service by the IP ranges its operator publishes, not by the name a client gives itself. A scraper that calls itself Googlebot but doesn't come from Google's ranges isn't counted as Googlebot. It shows up as unverified, and you can block fake crawlers. Only search and AI crawlers get crawler limits and per-provider AI crawler choices; other groups are named for reporting only. Internet scanners such as Censys are labelled, never trusted, and you can block them.
Your origin servers have their own group, so your own traffic doesn't blur the picture. If a service is missing, you can request it from the portal.
GooglebotBingbotGPTBotApplebotPerplexityBotClaudeAmazonbot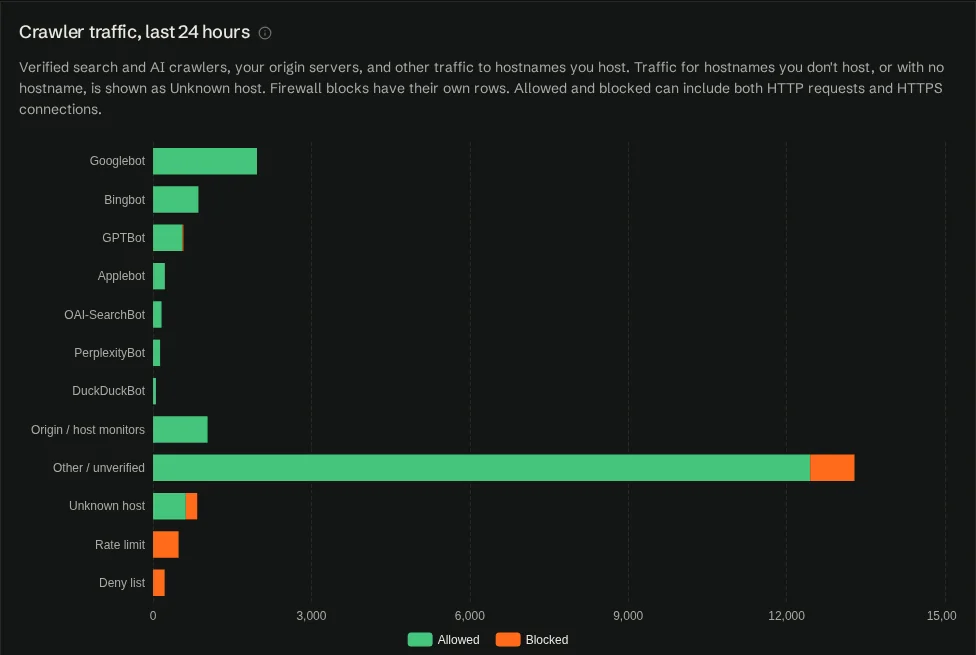
Every block, by address
Who was blocked, and why.
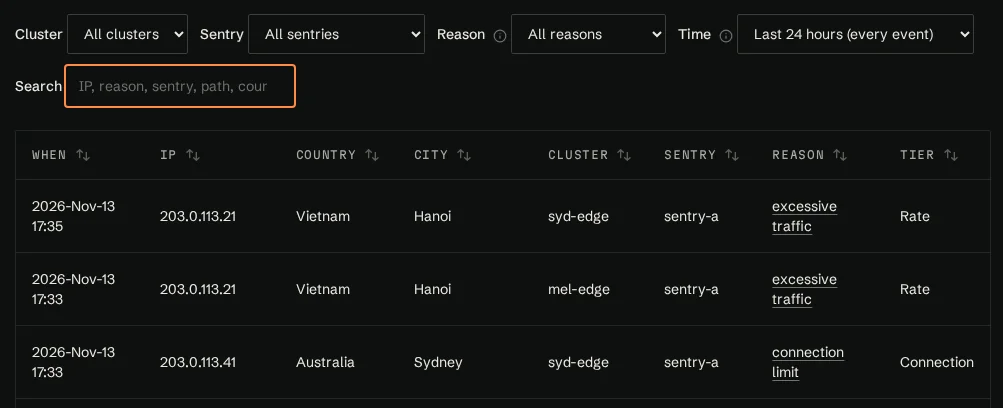
Logs cover blocked IPs, temporary bans, auth fails and WAF events. Auth fails show failed logins reported by the origin agent, by IP, country, city and service, with first and last seen. Web block reasons include unknown host, path traversal, sensitive paths and the WordPress rules. A top rules view shows which WAF rules are hitting your sites, and you can ignore a rule on a path in one click.
- Filter by cluster, sentry, reason and time, or search by IP, reason, sentry, path or country
- See temporary bans with the time left, and unban an address or make the ban permanent
- Export the current view to CSV
Domain by domain
Spot the busy site.
The Domains page lists every domain and its traffic, with Website protection on or off. It also flags certificate alerts when a certificate is close to expiry, or does not match the domain.
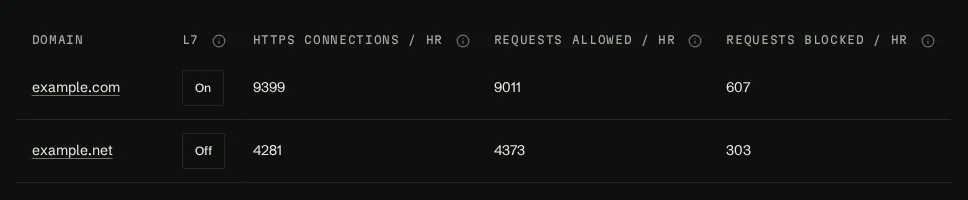
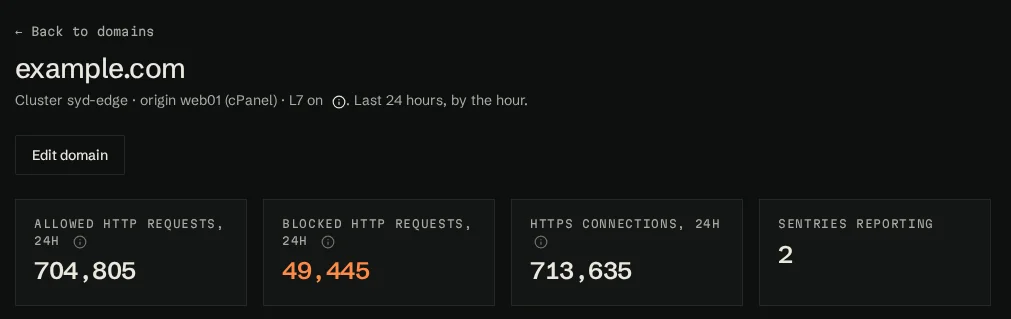
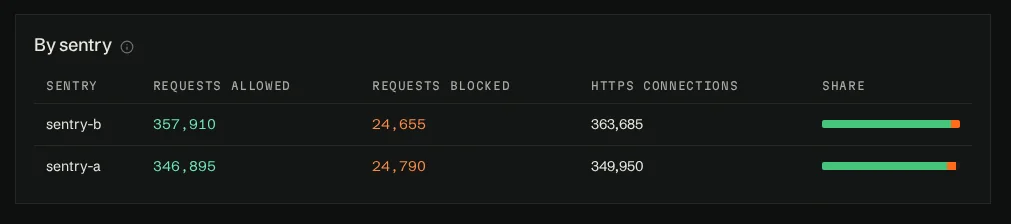
Open a domain for its traffic, a breakdown by sentry, identified traffic on that domain, Captcha Protection stats, the top block reasons and the top blocked IPs with their location.
When one customer's site is under pressure, you can see it there without digging through server logs.
Sentry load and capacity
Know when to add a sentry.
Each sentry has tiles averaged over the last minute for new connections, crawlers, open connections and traffic, each with the busiest IP against its per-IP limit.

Charts show the sentry's load (1 minute average) and its traffic over the last 24 hours.
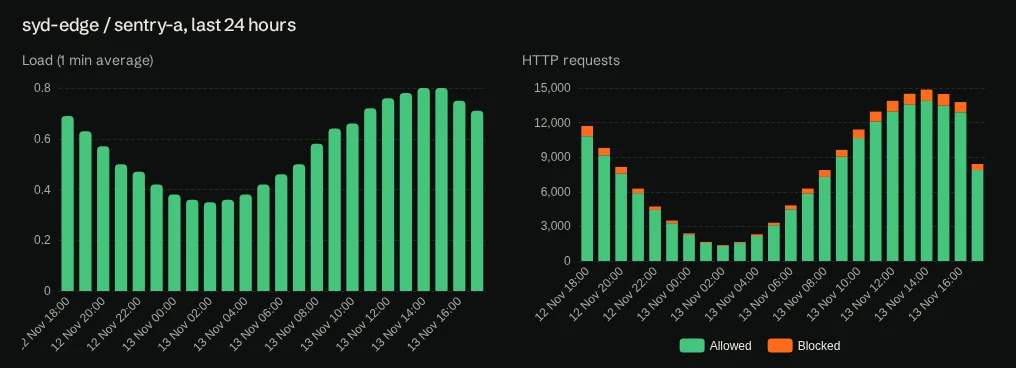
Capacity is shown as a percentage, with a warning at 70% and an alert at 80%, so you can add a sentry before one runs out of room.

Origin load
See when an origin is struggling.
Origin agents report load, and sentries notice slow origins themselves. In the portal you can see when an origin was under load.
When an origin is under pressure, Under load mode steps up: first it slows bots, then it tightens limits, and finally it shows visitors a busy page that tells browsers when to retry. Search engines are only held back in the worst case. You can also flip a manual Under Attack! switch, and turn on optional email alerts.
Act on what you see
Deny list
Each cluster has its own deny list. Add an address or a range, with a reason and an expiry, and the change reaches the cluster's sentries within a minute. Addresses from the stillorigin naughty list feed the deny list.

Naughty list delisting
If one of your customers' addresses is on the stillorigin naughty list, check it and ask for it to be delisted from the portal. About the naughty list →
Start a free trial, or read the docs.
Support and all customer communication go through the helpdesk ticket system in the portal. Pre-sales and media enquiries can use the contact form.